Design Thinking
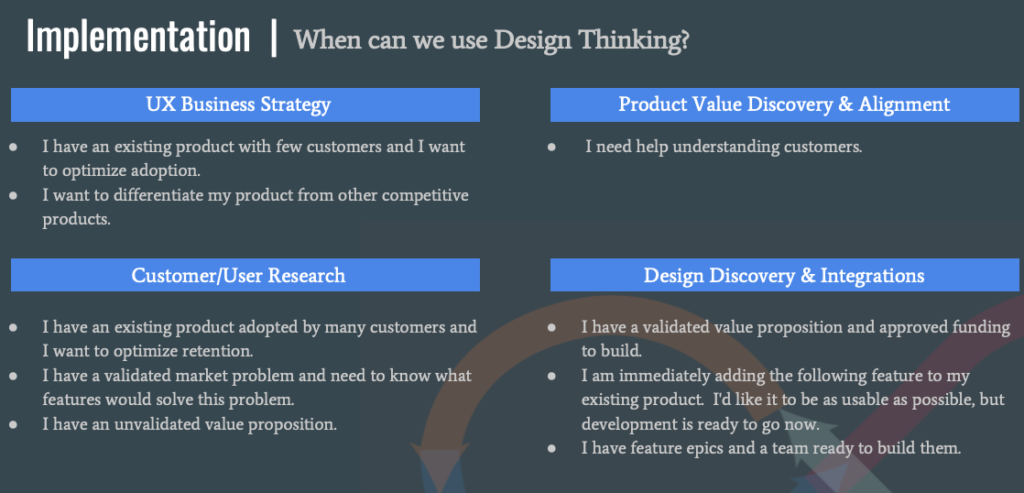
What is Design Thinking and why is it important?
Design Thinking is a process for creating products and services which are useful and delightful for users. It is a way of thinking and working that utilizes hands-on methods geared toward:
- Understanding the user
- Challenging assumptions
- Redefining problems
User satisfaction = Increased revenue
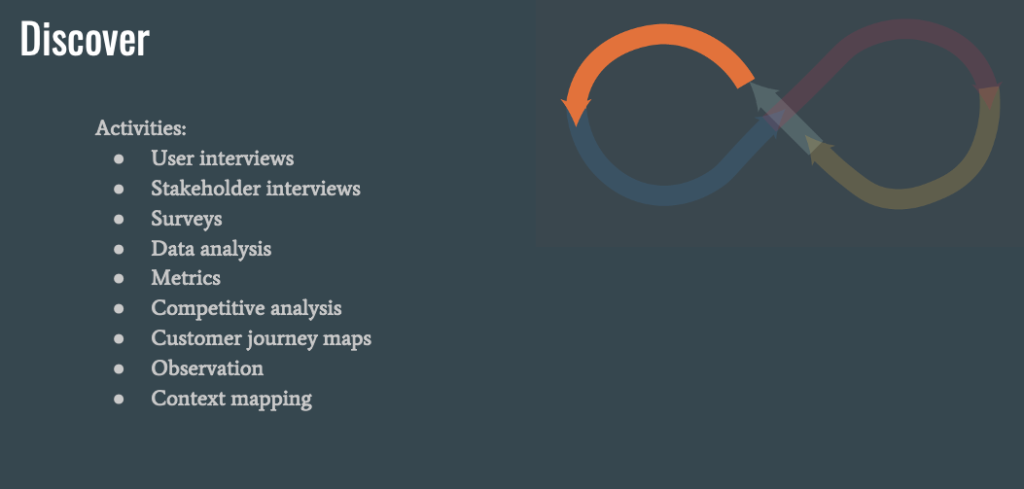
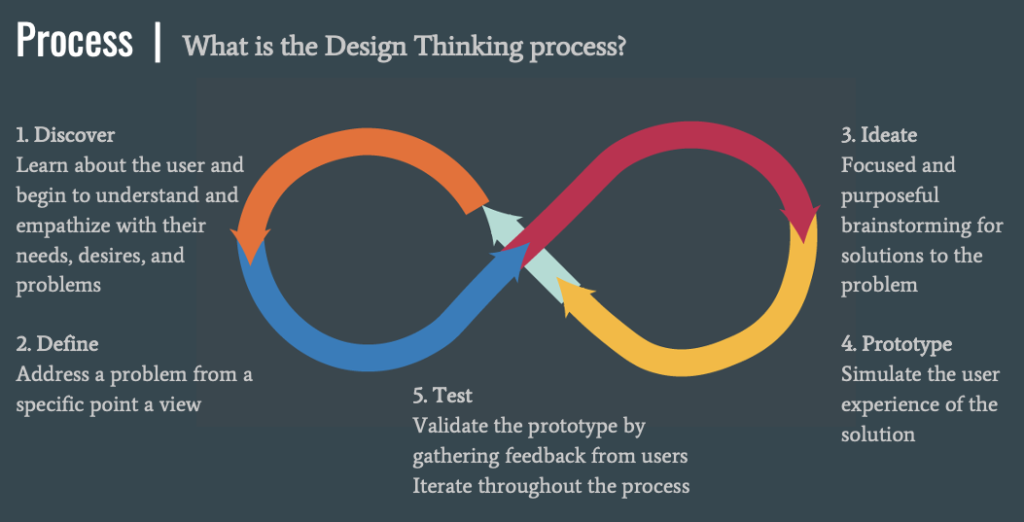
- Discover – Learn about the user and begin to understand and empathize with their needs, desires, and problems
Activities:- User interviews – qualitative research methods in which a researcher engages with individuals to gather insights, opinions, and feedback about a product, service, or experience.
- Stakeholder interviews – gather perspectives, expectations, and concerns of stakeholders to inform decision-making and ensure alignment with their interests and goals.
- Surveys – data collection tool used to gather information from a sample of individuals, typically through a set of structured questions.
- Data analysis – process of inspecting, cleaning, transforming, and modeling data to uncover meaningful patterns, draw conclusions, and support decision-making.
- Metrics – quantifiable measurements used to assess, track, and evaluate the performance, progress, or effectiveness of a process, system, or entity.
- Competitive analysis – evaluating and comparing the strengths and weaknesses of a business or product against those of its competitors.
- Customer journey maps – visual representations that illustrate the various stages and touchpoints a customer goes through when interacting with a product, service, or brand.
- Observation – gather qualitative data by directly observing and documenting actions, interactions, or natural occurrences without direct interaction with the subjects.
- Context mapping – visualizing and understanding the broader environment, circumstances, and factors that influence a particular situation, design, or problem.
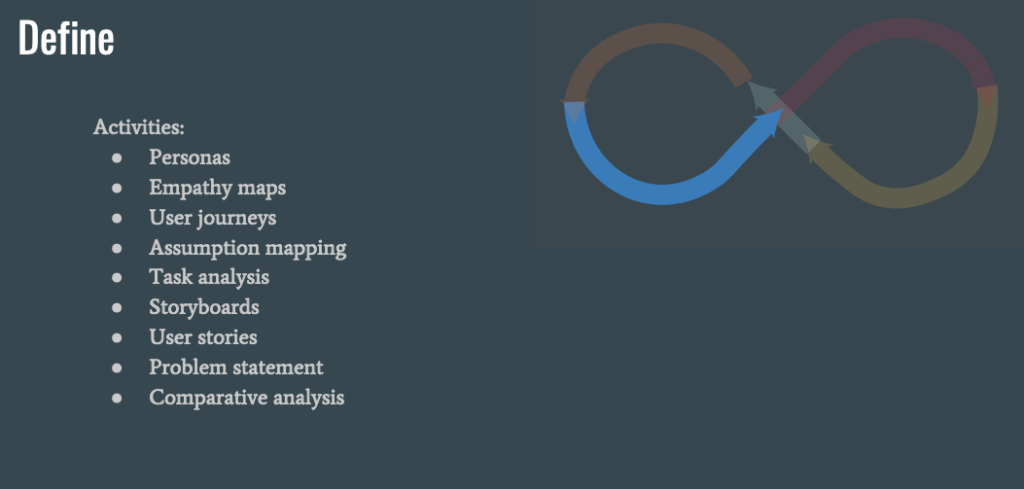
- Define – Address a problem from a specific point a view
Activities:- Personas – fictional, detailed representations of target users or customers created to understand their characteristics, needs, behaviors, and goals.
- Empathy maps – visual tools that capture and organize insights about a user’s thoughts, feelings, and behaviors.
- User journeys – various stages, touchpoints, and experiences users go through, providing a holistic view of their interactions with a product, service, or system.
- Assumption mapping – visually representing and documenting the assumptions that individuals or teams make about a project, product, or situation.
- Task analysis – systematic process of breaking down a complex activity or process into smaller, manageable components to understand the steps, actions, and cognitive processes involved.
- Storyboards – visual sequences of illustrations or images arranged in a chronological order, used to convey the narrative or flow of a story, process, or user experience.
- User stories – concise, user-focused descriptions of desired functionality or features written from the perspective of an end user. They typically follow a simple template (“As a [type of user], I want [an action] so that [benefit or goal]”).
- Problem statement – clear and concise description of an issue or challenge that needs to be addressed.
- Comparative analysis – examining and evaluating the similarities and differences between two or more entities, such as products, processes, or strategies.
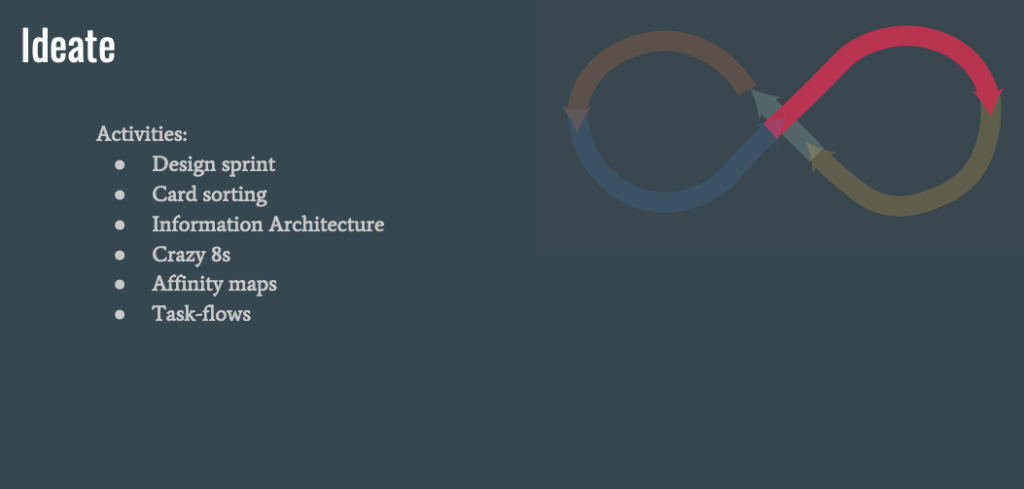
- Ideate – Focused and purposeful brainstorming for solutions to the problem
Activities:- Design sprint – time-constrained, collaborative process used by teams to solve complex problems and test ideas rapidly.
- Card sorting – participants organize information or content into groups or categories based on their perceptions and preferences.
- Information Architecture – organization, structure, and labeling of content in a way that facilitates effective navigation and understanding.
- Crazy 8s – design thinking exercise where participants sketch as many quick ideas or solutions as possible in eight minutes.
- Affinity maps – visual tool that help organize and categorize large amounts of information, ideas, or data generated during brainstorming or research sessions.
- Task-flows – visual representations that outline the step-by-step sequence of interactions and activities a user performs to accomplish a specific goal within a product, service, or system.
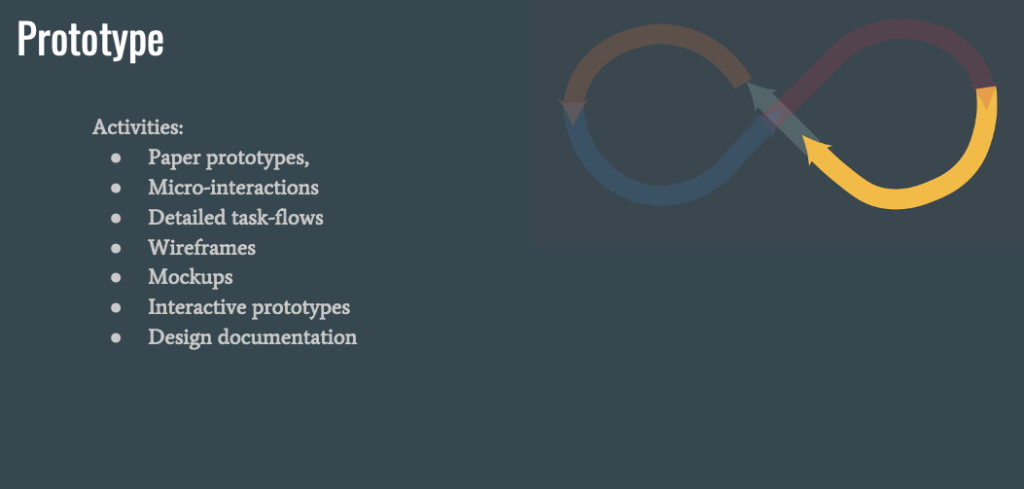
- Prototype – Simulate the user experience of the solution
Activities:- Paper prototypes – hand-drawn or printed representations of a user interface, allowing designers to quickly sketch and iterate on design ideas before moving to digital development.
- Micro-interactions – small, subtle animations or visual responses within a user interface that enhance user experience by providing feedback or guiding users through specific tasks.
- Detailed task-flows – comprehensive visual representations that outline the intricate steps and interactions users take to achieve specific goals within a product or system.
- Wireframes – simplified, skeletal representations of a user interface, illustrating layout, structure, and basic functionality without detailing visual design elements.
- Mockups – high-fidelity static representations of a user interface, incorporating visual design elements, colors, and typography to provide a realistic preview of the final product.
- Interactive prototypes – digital models of a user interface that allow users to interact with a simulated version of the product, providing a more dynamic and realistic user experience compared to static mockups.
- Design documentation – comprehensive records that document design decisions, guidelines, and specifications, serving as a reference for designers, developers, and other stakeholders throughout the project lifecycle.
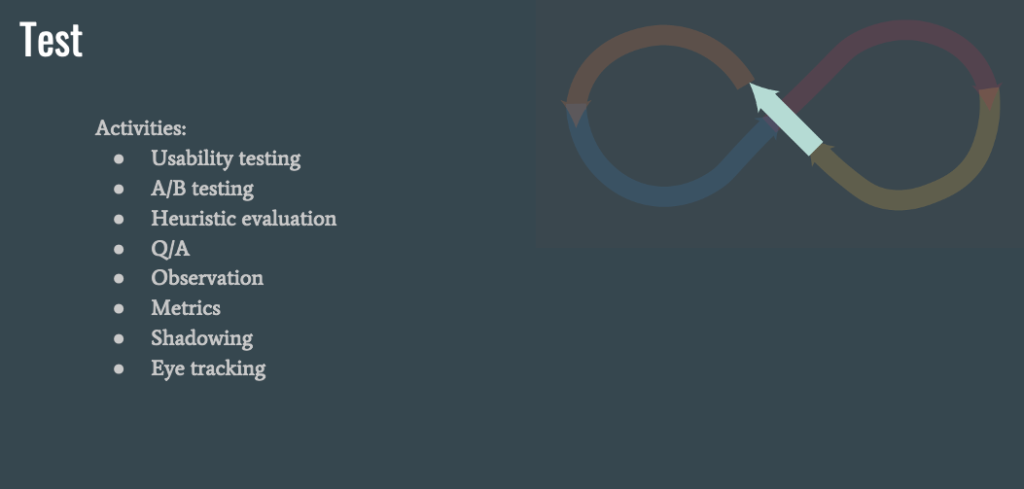
- Test – Validate the prototype by gathering feedback from users
Activities:- Usability testing – method of evaluating a product’s user interface by observing real users interacting with it, typically to identify usability issues and gather insights for improvement.
- A/B testing – controlled experiment where two or more variants (A and B) of a webpage, email, or other digital content are compared to determine which performs better in terms of user engagement or conversion rates.
- Heuristic evaluation – expert evaluation method where usability experts assess a user interface against a set of recognized usability principles or heuristics to identify potential usability issues.
- Q/A – process of ensuring that a product or system meets specified requirements and standards through systematic testing and validation.
- Observation – systematically watching and recording behaviors, interactions, or events to gather information, insights, or data in various research or testing contexts.
- Metrics – quantifiable measurements used to assess and analyze the performance, effectiveness, or success of a product, service, or system.
- Shadowing – research method where an observer follows and closely observes a user or subject during their daily activities to gain a deeper understanding of their behaviors, needs, and challenges.
- Eye tracking – technology used to measure and record eye movements and gaze points, providing insights into where users focus their attention within a visual stimulus, such as a webpage or interface.
